MPG Soil Monitor Introduction
Logging In
When you first open the Soil Monitor application, you will be alerted to the last time data was updated.
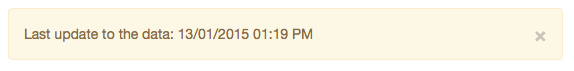
Keep in mind that this is when the data was uploaded, not the last data point available.
The Menu Bar
On the top of every page is the link to each part of the application
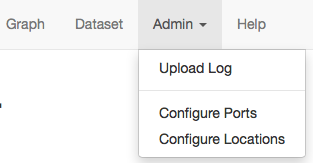
- Graph
- A graph of the selected data
- Dataset
- A table of the selected data
- Admin
- Upload Log - A list of files uploaded to the server. This is mostly here to allow downloading of the source xls file generated by Decagon
- Configure Ports - An interface to disable sensors from being displayed and to change sensor depth.
- Configure Locations - Configuration of location long names and coordinates for display on the map.
- Note: These settings are application wide. If you make a change here, it will affect all users
- Help
- This page
For your convience, your date range/location selection persists across different representations of the data. This is to say that if you change it in the graph view and then click dataset, you will be viewing the same date range/location.
The Graph View
At the top of the graph view is a selector for a date range and location. When you change date ranges or locations, the data will automatically be refreshed to that selection. For larger datasets, this can take some time to process.
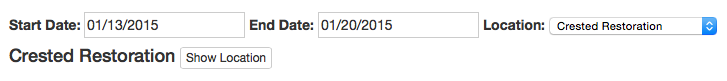
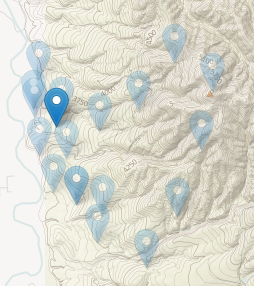
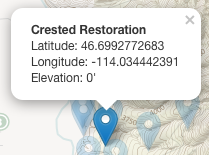
Additionally, next to the location name is a button titled Show Location. Clicking it will display a map of all locations with the selected location in a darker blue than the rest of the markers. Clicking any of the markers will display the location name and coordinates of that location.
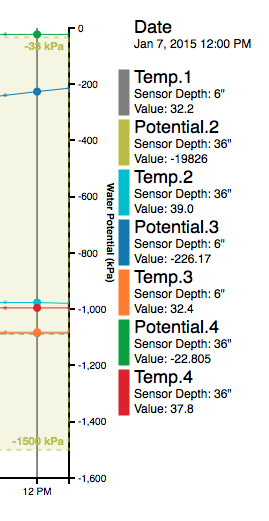
There is a legend on the right hand side of the graph that tells you the date, depth, and measurements for the point your mouse is hovered over on the graph. It also illustrates the color of the line for each type of data
As you move your mouse over the graph, the measurements being listed in the legend will be marked with a line and highlighting of the points on each line.
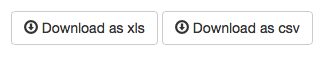
Also at the top of the graph are two buttons labeled Download as xls and Download as csv These buttons will take the current date/location dataset and download the dataset in Excel or CSV files, depending on which button you click
The Dataset View
This view has the same date and location selectors at the top and also has the same download buttons. As you might expect, this is the same data from the graph in tabular format.
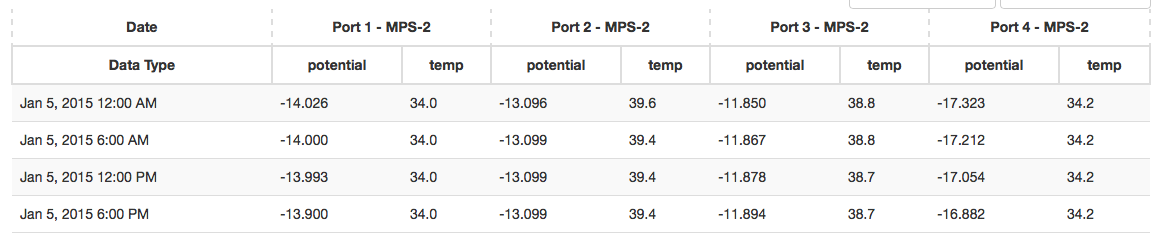
As with the graph view, if you select a new location or date range, the table will update. The same caveats apply with respect to amount of data and time to update.
Admin
Once again, changes made on this page will affect every user.
Upload Log
This table contains every file uploaded to the server by Decagon.
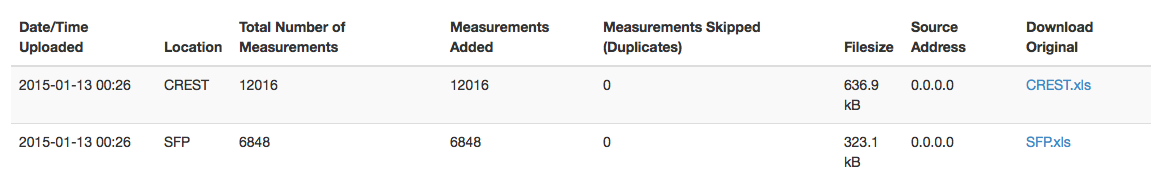
If you click the filename on the right hand side of the table, you can download the original file that was uploaded by Decagon.
This view is mostly for debugging of ingest problems and is unlikely to be used by a majority of users
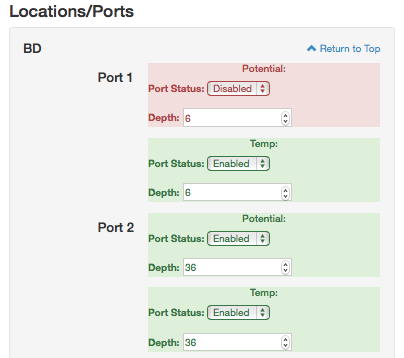
Configuring Ports
This is a list of every sensor available, grouped by location and then by port
There is a list of locations on the right hand side of the screen that will jump to that location for configuration.
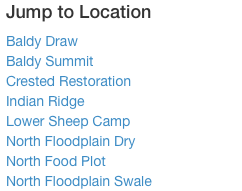
At the bottom of that list is a Submit Changes button. After you make any changes to enabled/disabled sensors, you must click this button to put the changes in effect. There is also a Return to Top button. Click this to jump to the top of the page.
Sensors enabled prior to submitting changes will be listed in green, and sensors disabled prior to submitting changes will be listed in red.
Each sensor also has a depth defined. These measurements are in inches.
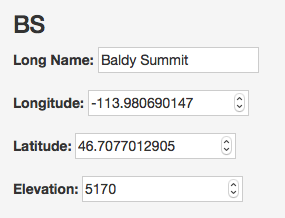
Configuring Locations
The interface is similar to the Configuring Ports page. There is a list of locations on the right along with the Submit Changes and Return to Top buttons.
By default, all locations have (0,0) as the coordinates. Updating them here will place them on the map. If the values are left at (0,0), the location will not be shown on the map
Initially, all locations will have their long name set to their uploaded file name. By setting the long name here, the display of the location in all maps and data views will be updated.
Elevation is for your information alone and will not affect any measurements.